Warning
VK_EXT_debug_marker is deprecated and has been replaced by VK_EXT_debug_utils. Please refer to this tutorial and sample instead.
Intro
The Vulkan validation layers included with the LunarG SDK are a must for debugging applications at run-time, and every Vulkan developer should get used to them as soon as possible. They are crucial for getting applications validated against the specification and ensure portability across different implementations.
But what they can’t catch are logical errors, so even with all validation layers enabled and all errors eliminated you still may not see what you where expecting and need an additional layer of debugging your rendering step-by-step.
This is where offline graphics debugging applications like RenderDoc come into play. RenderDoc is able to capture a frame of your application, including all API calls, objects and the complete pipeline state and displays all of that information within a nice UI.
While that’s already pretty useful for debugging purposes, Vulkan 1.0.12 introduced the new extension “VK_EXT_debug_marker” which is similar to OpenGL’s GL_KHR_Debug extension and adds the ability to name and tag objects and insert debug regions and markers to be displayed by an offline debugger.
This short tutorial will show you what new functionality this extension introduces and also includes a practical chapter, along with an open source C++ example, to demonstrate it’s usage in a Vulkan application and the graphics debugger.
Prerequisites
Enable capture in debugging application
Before starting to use the new extension, make sure you have at least one registered Vulkan layer with support for VK_EXT_debug_maker. The layer (along with the extension on this layer) should be enabled by the offline debugging application.
If you’re using RenderDoc open the “Capture executable” tab and check for a warning message:
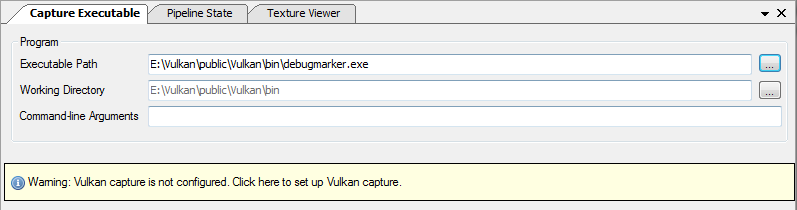
If you see this warning, RenderDoc’s capture layer has not yet been registered with the loader. Click on the warning and confirm the next dialog. After that the layer should be registered and you can start using RenderDoc with Vulkan. If you are on Windows you can check the list of layers registered by external applications (called “implicit layers”) by checking the HKEY_LOCAL_MACHINE\SOFTWARE\Khronos\Vulkan\ImplicitLayers registry key.
Vulkan headers
VK_EXT_debug_marker has been added with Vulkan header revision 12. So if you wan to use it in your own application grab the latest header or LunarG SDK. This tutorial is based on an example from my Vulkan C++ examples that includes a recent header.
Initialization
Now that we have the layer of a debugging application registered, we can start using it in our application. Note that the extension is only present if the application is run inside of the debugger.
Check extension availability
The first step is to check if the extension is available on the device we want to use for debugging. This is only true of the application is run from the debugger that has enabled it’s layer:
std::vector<VkExtensionProperties> extensions;
...
vkEnumerateDeviceExtensionProperties(physicalDevice, nullptr, &extensionCount, extensions.data());
for (auto& ext : extensions)
{
	if (!strcmp(ext.extensionName, VK_EXT_DEBUG_MARKER_EXTENSION_NAME))
	{
		extensionPresent = true;
	}
}
Enable extension
VK_EXT_debug_marker is a device extension (see specs) and as such has to be enabled during device creation:
std::vector<const char*> enabledExtensions = { ... };
VkDeviceCreateInfo deviceInfo = {};
...
if (extensionPresent && useDebugMarkers)
{
	enabledExtensions.push_back(VK_EXT_DEBUG_MARKER_EXTENSION_NAME);
	...
}
...
deviceInfo.enabledExtensionCount = enabledExtensions.size();
deviceInfo.ppEnabledExtensionNames = enabledExtensions.data();
...
vkCreateDevice(physicalDevice, &deviceInfo, nullptr, &device);
Note that it’s important to check if the extension is present first, as otherwise device creation may fail.
Acquire function pointers
Before we can use the new functions added by the debug marker extension, we need to acquire device function pointers for them:
pfnDebugMarkerSetObjectTag = (PFN_vkDebugMarkerSetObjectTagEXT)vkGetDeviceProcAddr(device, "vkDebugMarkerSetObjectTagEXT");
pfnDebugMarkerSetObjectName = (PFN_vkDebugMarkerSetObjectNameEXT)vkGetDeviceProcAddr(device, "vkDebugMarkerSetObjectNameEXT");
pfnCmdDebugMarkerBegin = (PFN_vkCmdDebugMarkerBeginEXT)vkGetDeviceProcAddr(device, "vkCmdDebugMarkerBeginEXT");
pfnCmdDebugMarkerEnd = (PFN_vkCmdDebugMarkerEndEXT)vkGetDeviceProcAddr(device, "vkCmdDebugMarkerEndEXT");
pfnCmdDebugMarkerInsert = (PFN_vkCmdDebugMarkerInsertEXT)vkGetDeviceProcAddr(device, "vkCmdDebugMarkerInsertEXT");
New functionality
Once the extension has been enabled on the device and the function pointers have been retrieved, we can start using the new functionality offered by the extension in our application.
Naming objects
The extension allows you to name all the different object types available in Vulkan. This includes images, samplers, all sorts of buffers, pipelines, synchronization objects, pools and much more. These names can then be displayed by an offline debugging application to help keeping track of them.
Naming information is set using vkDebugMarkerSetObjectName, which takes in a VkDebugMarkerObjectNameInfoEXT structure that contains the type of object to be named as well as it’s handle. Object names can be set anywhere in your code after the object has been created. All object identifiers in Vulkan are stored as 64-bit handles, so it’s safe to cast all objects to be named as 64-bit unsigned integers:
VkDebugMarkerObjectNameInfoEXT nameInfo = {};
nameInfo.sType = VK_STRUCTURE_TYPE_DEBUG_MARKER_OBJECT_NAME_INFO_EXT;
// Type of the object to be named
nameInfo.objectType = VK_DEBUG_REPORT_OBJECT_TYPE_COMMAND_BUFFER_EXT;
// Handle of the object cast to unsigned 64-bit integer
nameInfo.object = (uint64_t)commandBuffer;
// Name to be displayed in the offline debugging application
nameInfo.pObjectName = "Primary Command Buffer";
pfnDebugMarkerSetObjectName(device, &nameInfo);
As with most Vulkan functions you should encapsulate the above code into a function that hides away the boilerplate:
void DebugMarker::setObjectName(VkDevice device, uint64_t object, VkDebugReportObjectTypeEXT objectType, const char *name)
{
	// Check for a valid function pointer
	if (pfnDebugMarkerSetObjectName)
	{
		VkDebugMarkerObjectNameInfoEXT nameInfo = {};
		nameInfo.sType = VK_STRUCTURE_TYPE_DEBUG_MARKER_OBJECT_NAME_INFO_EXT;
		nameInfo.objectType = objectType;
		nameInfo.object = object;
		nameInfo.pObjectName = name;
		pfnDebugMarkerSetObjectName(device, &nameInfo);
	}
}
If you want to save even more boilerplate you could use some overloads, templates or dedicated functions (e.g. setSamplerName, setPipelineName) that preset the objectType member of the name info structure (see e.g. vulkandebug.cpp from my example base code).
Tagging objects
It’s also possible to add multiple tags to your objects with arbitrary data:
VkDebugMarkerObjectTagInfoEXT tagInfo = {};
tagInfo.sType = VK_STRUCTURE_TYPE_DEBUG_MARKER_OBJECT_TAG_INFO_EXT;
tagInfo.objectType = VK_DEBUG_REPORT_OBJECT_TYPE_BUFFER_EXT;
tagInfo.object = (uint64_t)someBuffer;
tagInfo.tagName = 0x01;
// Size of the arbitrary data structure
tagInfo.tagSize = sizeof(customTag);
// Pointer to the arbitrary data
tagInfo.pTag = &customTag;
pfnDebugMarkerSetObjectTag(device, &tagInfo);
Debug markers and regions
In addition to naming and tagging objects the extension also adds the ability to place debug markers inside command buffers. These can be used to mark points of interest and highlight specific areas inside of the command buffer.
Note that contrary to naming objects, debug markers (and regions) have to placed inside of an active command buffer, between vkBeginCommandBuffer and vkEndCommandBuffer.
In addition to object names, debug markers can also pass color information to the debugging app for better visualization.
Debug markers
Debug markers can be placed anywhere inside an active command buffer and don’t have to be encapsulated by a debug marker region:
vkBeginCommandBuffer(primaryCommand, &cmdBeginInfo);

VkDebugMarkerMarkerInfoEXT markerInfo = {};
markerInfo.sType = VK_STRUCTURE_TYPE_DEBUG_MARKER_MARKER_INFO_EXT;
memcpy(markerInfo.color, &color[0], sizeof(float) * 4);
markerInfo.pMarkerName = "Set primary viewport";
pfnCmdDebugMarkerInsert(cmdbuffer, &markerInfo);

vkCmdSetViewport(...)

vkEndCommandBuffer(primaryCommand);
Debug marker regions
While debug markers can be used to mark points of interest, debug marker regions can be used to group and organize API calls. Markers set inside a region will be contained within it and the regions also support nesting, which is useful for complex scenarios.
vkBeginCommandBuffer(primaryCommand, &cmdBeginInfo);

VkDebugMarkerMarkerInfoEXT markerInfo = {};
markerInfo.sType = VK_STRUCTURE_TYPE_DEBUG_MARKER_MARKER_INFO_EXT;
// Color to display this region with (if supported by debugger)
float color[4] = { 0.0f, 1.0f, 0.0f, 1.0f };
memcpy(markerInfo.color, &color[0], sizeof(float) * 4);
// Name of the region displayed by the debugging application
markerInfo.pMarkerName = "Off-screen render pass";
pfnCmdDebugMarkerBegin(primaryCommand, &markerInfo);

// Bind pipelines, descriptor sets, draw vertices, etc.

pfnCmdDebugMarkerEnd(primaryCommand);

vkEndCommandBuffer(primaryCommand);
In practice
C++ example application
For the practical part of this tutorial I wrote a simple C++ application that will be used to demonstrate the usage of the new extension along with an offline debugging application.
Sources: https://github.com/SaschaWillems/Vulkan/tree/master/debugmarker (as a part of my C++ Vulkan example repository)
Binaries:
The example creates multiple pipelines and uses two render passes. The first one is an off-screen pass that renders the glow parts of the scene to a low resolution frame buffer that is copied to a texture target. The second pass renders the scene with multiple draw calls using a simple toon shader and then draws a full-screen quad using the off-screen texture to apply a glow effect:
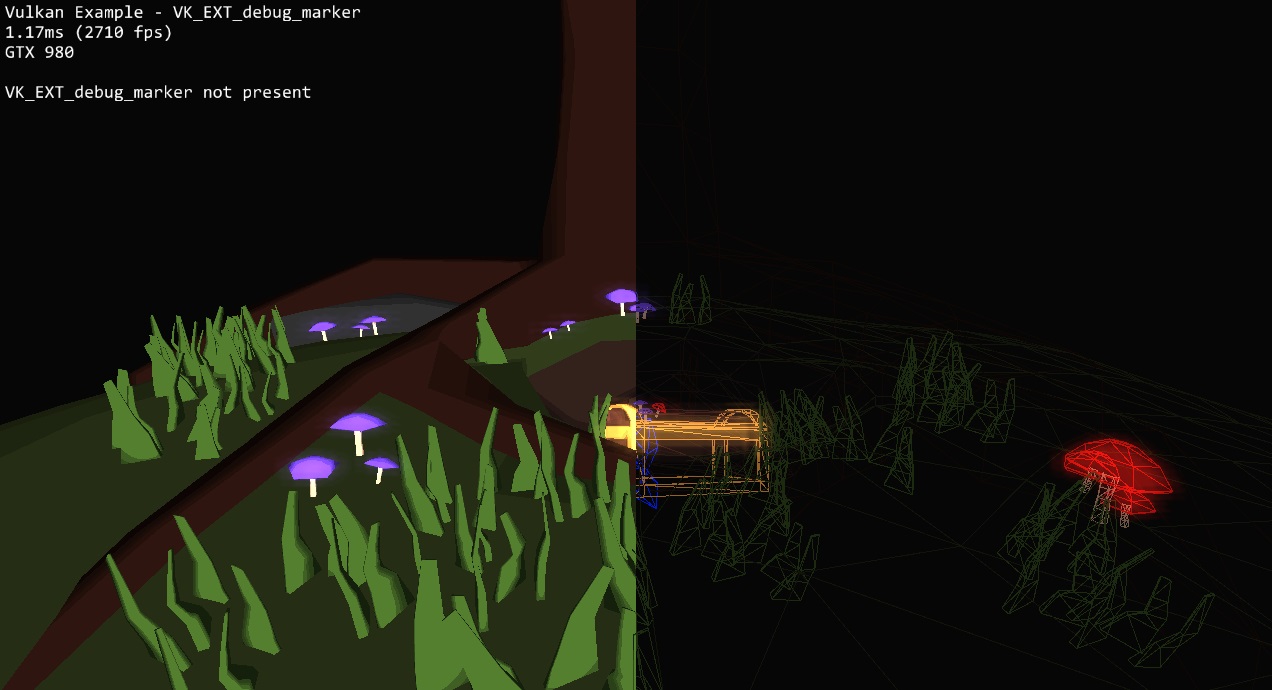
It also uses the example base class text overlay to display presence of the debug marker extension. If run outside of a debugger it should state that the extension is not present.
The example encapsulates the debug marker functionality within a namespace:
namespace DebugMarker
{
	// Get function pointers for the debug report extensions from the device
	void setup(VkDevice device)

	// Sets the debug name of an object
	// All Objects in Vulkan are represented by their 64-bit handles which are passed into this function
	// along with the object type
	void setObjectName(VkDevice device, uint64_t object, VkDebugReportObjectTypeEXT objectType, const char *name)

	// Set the tag for an object
	void setObjectTag(VkDevice device, uint64_t object, VkDebugReportObjectTypeEXT objectType, uint64_t name, size_t tagSize, const void* tag)

	// Start a new debug marker region
	void beginRegion(VkCommandBuffer cmdbuffer, const char* pMarkerName, glm::vec4 color)

	// Insert a new debug marker into the command buffer
	void insert(VkCommandBuffer cmdbuffer, std::string markerName, glm::vec4 color)

	// End the current debug marker region
	void endRegion(VkCommandBuffer cmdBuffer)
};
RenderDoc
RenderDocis a stand-alone graphics debugger that has been released alongside the LunarG Vulkan SDK, and as such is one of the first to support Vulkan. It’s developer (Baldur Karlsson) also wrote the specification for the debug marker extension.
As the debugger is constantly evolving it’s advised to either use the latest build from here, or (better) compile a current version from the sources. For this example we do the latter. If you aren’t familiar with RenderDoc yet, you can check out it’s documentation over here.
Capture
Start up RenderDoc and select the example application’s binary for capturing. You may also want to queue a capture under “Actions” so that RenderDoc automatically captures the second frame (if not, use F12 to capture at any point):
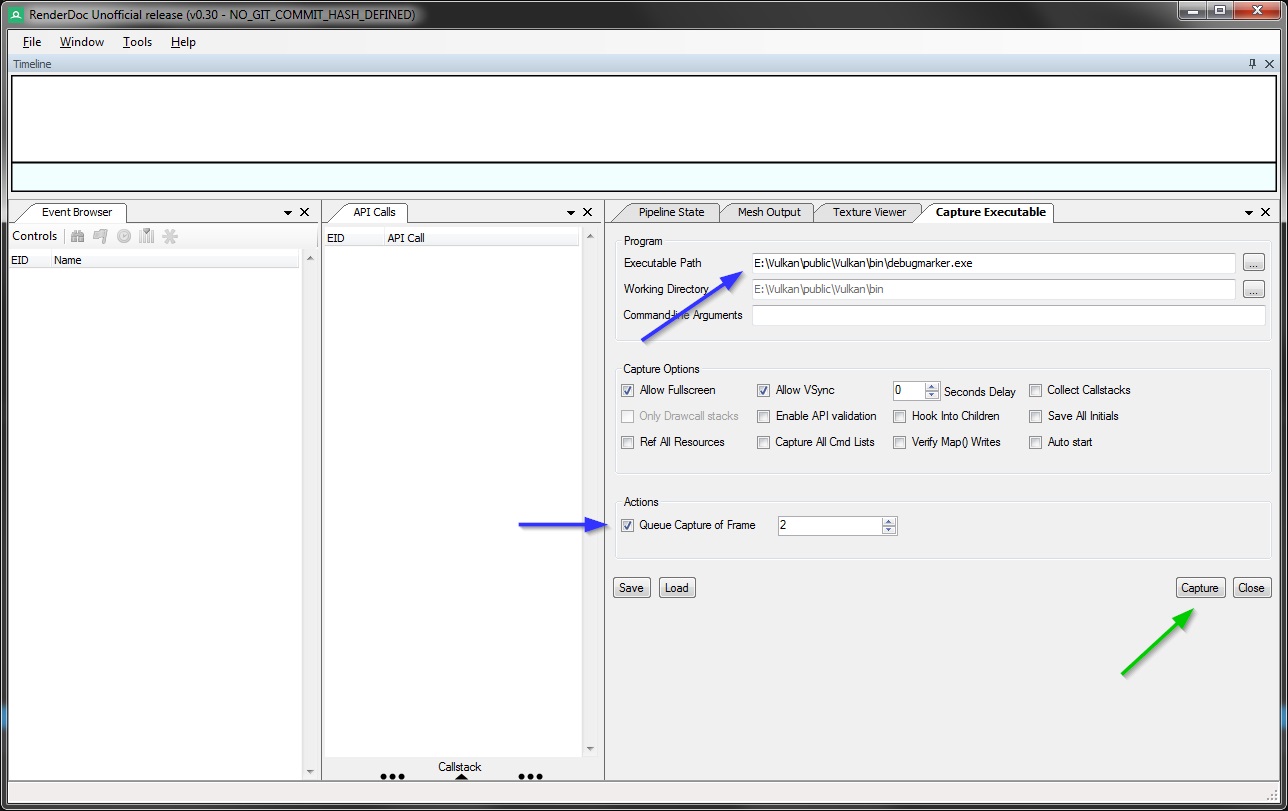
Press “capture” to start the application and the capture. If everything was set up correctly, the text overlay in the example should state the the extension is active and you can either wait for the queued capture to be triggered or trigger it yourself.
Visualization
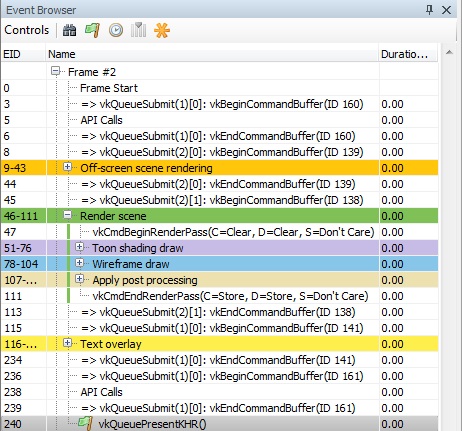
Now close the application (after a frame has been captured). RenderDoc will load the frame capture and display the final result of the render pass along with all API calls for that frame. Note that the UI may differ depending on how (or if) you have set up your layout. One thing you can immediately spot are the debug marker regions set inside the example applications.
If you use the latest RenderDoc version built from source you get them displayed with their colors passed from the example:
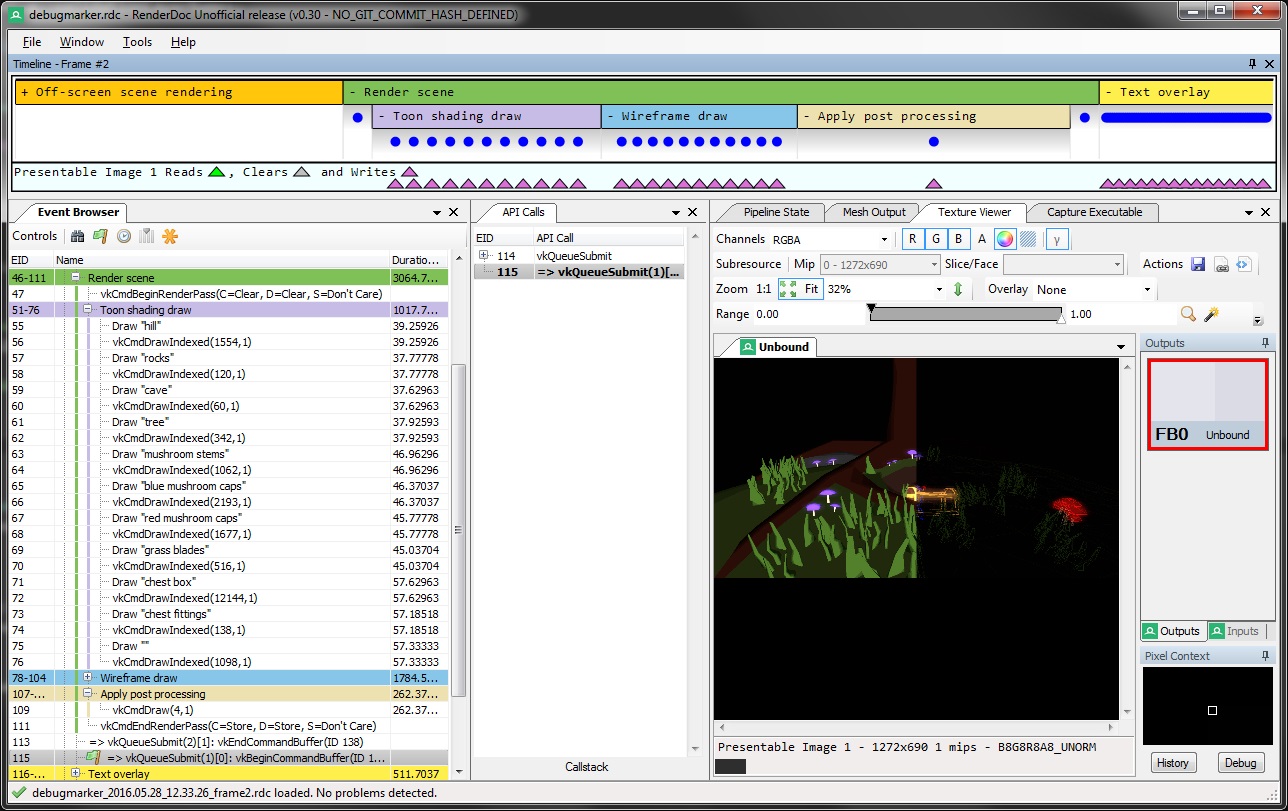
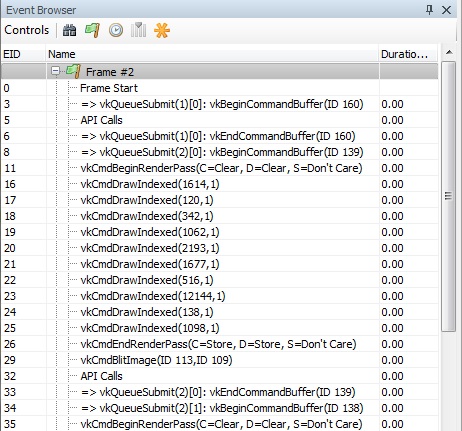
The event browser will display all calls of the captured frame, while the API calls pane displays all calls made between the currently selected and previous draw call, including the state of that API call (e.g. regions for buffer copies).
This also means you can replay a whole frame by moving through the event browser step by step:
Debug marker regions
Most noticeable are the debug marker regions, as they add an important layer of structuring to the event browser including colors. Comparing a frame without debug marker regions and colors to one with these enabled makes the advantages obvious:
The debug regions are also visualized on the frame’s timeline:

Here is the stripped down code from the example that sets up the nested debug marker regions for rendering the scene:
void VulkanExample::buildCommandBuffers()
{
	// For each command buffer
	vkBeginCommandBuffer(drawCmdBuffers[i], &cmdBufInfo);

	DebugMarker::beginRegion(drawCmdBuffers[i], "Render scene", glm::vec4(0.5f, 0.76f, 0.34f, 1.0f));

	vkCmdBeginRenderPass(drawCmdBuffers[i], &renderPassBeginInfo, VK_SUBPASS_CONTENTS_INLINE);

	// Set dynamic states, etc.

	DebugMarker::beginRegion(drawCmdBuffers[i], "Toon shading draw", glm::vec4(0.78f, 0.74f, 0.9f, 1.0f));
	// Draw scene
	DebugMarker::endRegion(drawCmdBuffers[i]);

	// Wireframe rendering
	if (wireframe)
	{
		DebugMarker::beginRegion(drawCmdBuffers[i], "Wireframe draw", glm::vec4(0.53f, 0.78f, 0.91f, 1.0f));
		// Draw scene
		DebugMarker::endRegion(drawCmdBuffers[i]);
	}

	// Post processing
	if (glow)
	{
		DebugMarker::beginRegion(drawCmdBuffers[i], "Apply post processing", glm::vec4(0.93f, 0.89f, 0.69f, 1.0f));
		// Draw full screen quad
		DebugMarker::endRegion(drawCmdBuffers[i]);
	}

	vkCmdEndRenderPass(drawCmdBuffers[i]);

	DebugMarker::endRegion(drawCmdBuffers[i]);

	vkEndCommandBuffer(drawCmdBuffers[i]);
}
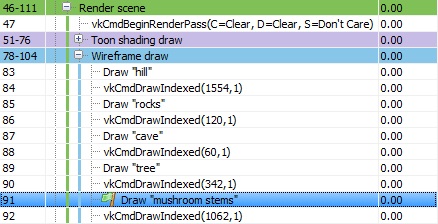
Debug markers
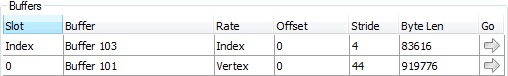
As the example only uses one vertex and index buffer for the whole scene, offsetting the indices for rendering the separate scene parts, it uses debug markers to annotate what part of the scene is submitted by the next draw call. If your application uses one buffer per mesh you could instead name that buffer:
 ]
]
Source:
void Scene::draw(VkCommandBuffer cmdBuffer)
{
	VkDeviceSize offsets[1] = { 0 };
	vkCmdBindVertexBuffers(cmdBuffer, VERTEX_BUFFER_BIND_ID, 1, &vertices.buf, offsets);
	vkCmdBindIndexBuffer(cmdBuffer, indices.buf, 0, VK_INDEX_TYPE_UINT32);
	for (auto mesh : meshes)
	{
		DebugMarker::insert(cmdBuffer, "Draw \"" + mesh.name + "\"", glm::vec4(0.0f));
		vkCmdDrawIndexed(cmdBuffer, mesh.indexCount, 1, mesh.indexStart, 0, 0);
	}
}
Named objects
Unnamed objects show up with numerical IDs, making it hard to tell what they actually refer to in complex scenarios. Putting names on these things make it easy to track and identify the Vulkan objects in different parts of the pipeline displayed by RenderDoc.
For example buffers in the vertex input pipeline state:
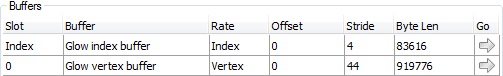
Source:
DebugMarker::setObjectName(
	device,
	(uint64_t)sceneGlow.vertices.buf,
	VK_DEBUG_REPORT_OBJECT_TYPE_BUFFER_EXT,
	"Glow vertex buffer");
DebugMarker::setObjectName(
	device,
	(uint64_t)sceneGlow.indices.buf,
	VK_DEBUG_REPORT_OBJECT_TYPE_BUFFER_EXT,
	"Glow index buffer");
Shader modules in the fragment shader pipeline state:
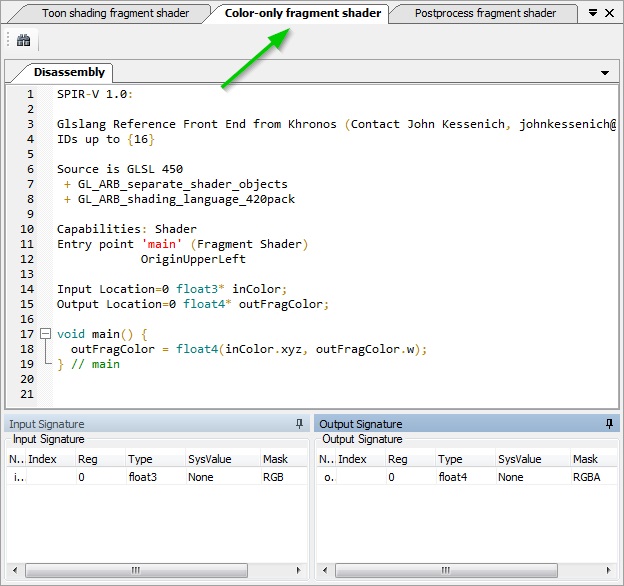
Source:
DebugMarker::setObjectName(
	device,
	(uint64_t)shaderModules[0],
	VK_DEBUG_REPORT_OBJECT_TYPE_SHADER_MODULE_EXT,
	"Toon shading vertex shader");
DebugMarker::setObjectName(
	device,
	(uint64_t)shaderModules[1],
	VK_DEBUG_REPORT_OBJECT_TYPE_SHADER_MODULE_EXT, "Toon shading fragment shader");
The final verdict
With the recently added VK_EXT_debug_marker extension and offline debugging tools like RenderDoc, debugging your actual render code in Vulkan is now even easier than before. While the validation layers will help you getting your code validated against the specifications and avoiding error, offline debugging allows you to check the render composition and resource usage in detail, and with the ability to define your own debug regions and markers and name the different Vulkan objects, debugging even complex apps should now be a lot easier.